2026 Class 8 Mathematics · English Version · Chapter 11 · Chapter companion part
Chapter 11B: Histograms, pie charts and honest scales
Build and interpret numerical-interval and part-of-whole charts, with correct areas, angles, units and limitations.
About this lesson and its coverage
Class 8 English Version: part B of the Chapter 11 companion. Eight teaching sections and 30 original written tasks. Selected companion coverage, not complete textbook coverage; use all four parts. Written interpretation, chart drawing and complete working need guardian or teacher review.
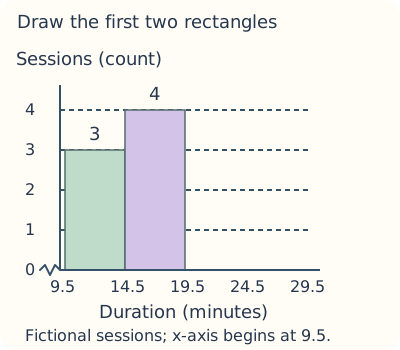
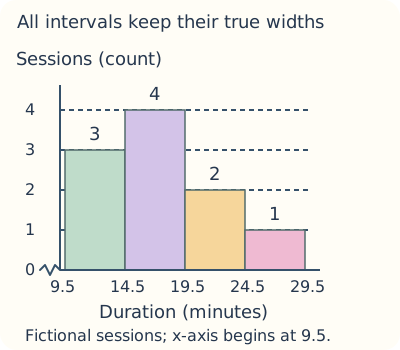
A histogram shows the distribution of numerical observations over adjacent intervals. For equal class widths, rectangle heights can show frequency, the number of observations in each interval. Our fictional whole-minute session classes have frequencies 3,4,2,1. The horizontal axis is session length in minutes; the vertical axis is number of sessions. Equal-width rectangles touch at shared boundaries. Separate category bars answer a different question and commonly have gaps.
Use boundaries consistently
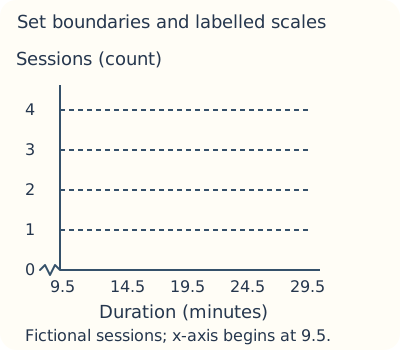
For nearest-minute records 10–14,15–19,20–24,25–29, use boundaries 9.5,14.5,19.5,24.5,29.5. Each rectangle is five minutes wide. An actual value 14.5 belongs to the second half-open interval under our explicit lower-inclusive rule. The first boundary is not zero: label the omitted horizontal stretch with a break or state that the axis begins at 9.5. Frequency height still begins at zero.
Keep scales and empty intervals visible
Choose a constant scale on each axis, label every unit and draw the frequency baseline at 0. If a group has frequency 0, its rectangle has zero height but its horizontal interval remains. Cutting the vertical axis can exaggerate differences; a broken horizontal axis is only an honest omission when labelled and intervals retain their widths. A taller histogram rectangle means more observations in equal-width bins, not larger individual values.
Unequal widths need area, not raw height
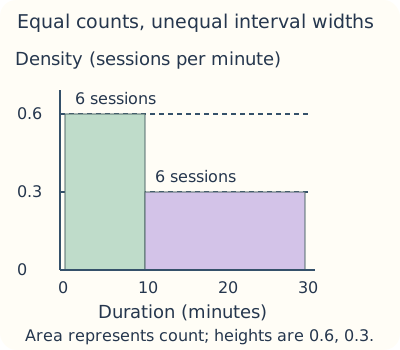
Frequency density means frequency divided by interval width: observations per unit on the horizontal axis. This is an extension beyond the book’s equal-width examples. For intervals 0–10 and 10–30 with six sessions each, widths 10 and 20 give densities 0.6 and 0.3 sessions per minute. The wider rectangle must be half as tall so both areas represent six sessions. Plotting equal heights would wrongly give the wider class twice the represented count.
A pie divides one clearly defined whole
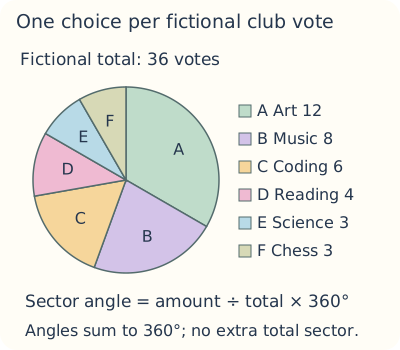
A pie chart divides a circle into sectors whose areas and central angles represent shares of one positive total. Our fictional 36 club votes choose one activity each: Art 12, Music 8, Coding 6, Reading 4, Science 3, Chess 3. The total is 36 votes, not minutes or achievement. Each vote is one thirty-sixth of the circle, so10°. The categories must be non-overlapping parts of the same whole; do not add the total as another sector.
Convert counts to angles and back
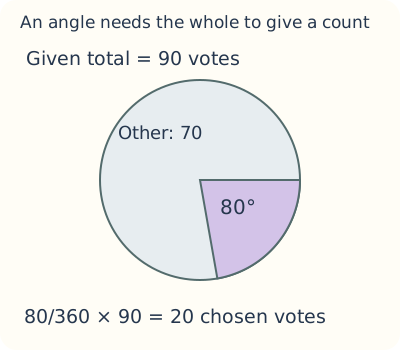
For category amount f out of total N, angleθ=(f/N)×360°. Reverse it with f=N×θ/360°. In the club example, eight Music votes give 80°, meaning eight of 36 choices. An80° sector out of a separate total 90 votes would instead mean 20 votes. The angle alone does not reveal the count unless the total is known. Use nonnegative amounts and a positive total; an empty total cannot be divided into meaningful shares.
Construct the circle with a protractor
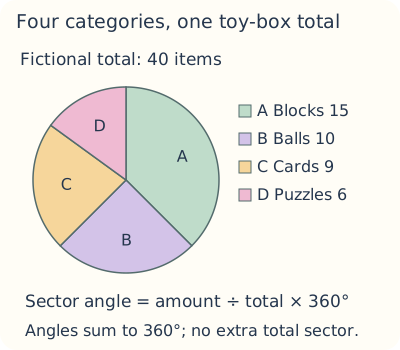
First check all amounts sum to N. Convert each to degrees and check their sum is 360°. Draw a circle, a starting radius and successive central angles, then label each sector or a matching key. Our six activity angles are 120°,80°,60°,40°,30°,30°. Small rounding differences in other data should be disclosed and corrected for the drawing without pretending the underlying counts changed. A four-category toy example uses counts 15,10,9,6 out of 40 and angles 135°,90°,81°,54°.
Explain what the chart can support
A pie of individual heights represents shares of the sum of centimetres, not shares of students. The source suggests height and family-age pies; label that unusual whole if used, or choose one-choice category counts instead. Accident counts alone also do not measure risk per journey without exposure information. A histogram describes a distribution; a pie describes composition. State the population, period, unit and whether the records are fictional before drawing conclusions.
Worked example
In the invented 36-vote club pie, Music has 8 votes. Its share 8/36 becomes 80°; reversing 80/360×36 returns 8. The angle measures a share of the stated whole, not a count on its own.
Name the observations, unit, total and question. Explain what the requested summary or chart measures.
Show sorting, counts, boundaries or a fully labelled calculation. State whether the result is exact for the listed records or a grouped estimate.
Check totals, positions, units and arithmetic. Explain the result in context and say what the data cannot establish.
Source activities need a meaningful whole
A pie of heights or ages is a share of summed centimetres or years. It does not count people in categories.
Unequal-width extension
The book’s frequency-height examples use equal widths. The additional density model shows why histogram area must represent frequency when widths differ.
Club votes become angles
Fictional 36 one-choice votes. The whole is the vote count, not the sum of activity prices or durations.
Club votes become angles
Activity
Votes
Share of 36
Angle
Art
12
1/3
120°
Music
8
2/9
80°
Coding
6
1/6
60°
Reading
4
1/9
40°
Science
3
1/12
30°
Chess
3
1/12
30°
Total
36
1
360°
Music has 8/36 of these votes, represented by 80°. It is not 80 votes and the table does not describe all children’s preferences.
A four-category toy pie
Fictional 40 items. Count each item in one category.
A four-category toy pie
Category
Item count
Angle
Blocks
15
135°
Balls
10
90°
Cards
9
81°
Puzzles
6
54°
Total
40
360°
Nine cards out of 40 give 9/40×360=81°. The four angles total 360°, so there is no extra total sector.
Unequal widths: compare areas
Extension with fictional session durations and exactly six records in each class.
Unequal widths: compare areas
Interval (minutes)
Width (minutes)
Count
Density (sessions/minute)
0≤x<10
10
6
0.6
10≤x<30
20
6
0.3
Each width×density is 6 sessions. Rectangle areas represent counts; equal-height raw-frequency bars would double the represented count for the wider interval.
From a category count to an angle
Music has f=8 out of N=36 fictional club votes.
θ=(f/N)×360°
θ=(8/36)×360°=80°
θ
Central angle, measured in degrees.
f
The amount in one non-overlapping category.
N
Positive whole-pie total, in the same unit as f.
Sum category amounts to check N.
Divide category amount by the whole.
Multiply the share by 360°.
Check all sectors together make 360°.
80° represents 8 of 36 votes here. The angle is a share of a stated whole, not a stand-alone count.
From an angle back to its count
A chosen 80° sector belongs to a separate total of 90 votes.
f=N×θ/360°
f=90×80/360=20 votes
N
The supplied total 90 votes.
θ/360°
The chosen share 80/360=2/9.
f
Twenty chosen votes, not twenty degrees.
Identify the whole.
Convert the angle to a fraction of 360°.
Multiply by the whole.
Check the remainder 90−20=70.
A supplied angle without a total cannot determine an absolute count. Counts remain whole numbers when the data and angle are consistent.
Build the histogram one step at a time
Fictional nearest-minute session records. No automatic start; use the stage buttons or read all static frames.
All stages: readable static alternative
1 · Set boundaries and scales: Horizontal boundaries 9.5–29.5 minutes are five minutes apart. The vertical axis counts sessions from zero; the horizontal zigzag discloses the omitted earlier stretch.
2 · Plot the first two classes: The first two touching rectangles are five minutes wide and 3,4 sessions high. Use one consistent scale.
3 · Complete and interpret: The remaining heights 2,1 complete ten sessions. The largest class count 4 is in 14.5≤x<19.5; grouping hides the exact durations within it.
Manual steps, replay and static alternatives. No autoplay; reduced-motion and hidden-page pause are retained.
Explore the mathematical figures
Match each letter to its explanation. Read the quantities, units and relationships, then check the counts or equations. These are original teaching models.
Build a histogram from continuous boundaries
The four rectangles represent ten fictional nearest-minute session records. Width is an interval; height is a count. The axis break does not truncate the vertical frequency baseline.
Sessions (count)
Vertical axis from zero, one session per tick; heights represent frequencies for equal widths.
Duration (minutes)
Horizontal boundary scale, twelve pixels per minute.
9.5
The first displayed boundary. The small zigzag marks the omitted earlier horizontal stretch.
Original diagram using fictional classroom records, not measured personal information or current statistics. Read the quantities, units and conventions beside the figure; colour alone does not carry the meaning.
Explore the mathematical figures
Match each letter to its explanation. Read the quantities, units and relationships, then check the counts or equations. These are original teaching models.
Keep a zero-frequency interval
The second rectangle has zero height. Retain that interval so later rectangles remain at their true numerical positions.
Sessions (count)
Vertical frequency, beginning at zero.
Duration (minutes)
Equal ten-minute widths begin at 0,10,20,30.
zero sessions
The 10–20 interval has no observed sessions, rather than missing data or a collapsed horizontal scale.
Original diagram using fictional classroom records, not measured personal information or current statistics. Read the quantities, units and conventions beside the figure; colour alone does not carry the meaning.
Explore the mathematical figures
Match each letter to its explanation. Read the quantities, units and relationships, then check the counts or equations. These are original teaching models.
Use rectangle area for unequal widths
This extension explains why raw frequency heights only work directly for equal-width histograms. The wider rectangle is half as tall so width×density gives the same count.
Density (sessions per minute)
Frequency divided by interval width; this is the vertical scale.
Duration (minutes)
The second interval is twice as wide as the first.
6 sessions
Each area represents six observations, despite the different heights.
Original diagram using fictional classroom records, not measured personal information or current statistics. Read the quantities, units and conventions beside the figure; colour alone does not carry the meaning.
Explore the mathematical figures
Match each letter to its explanation. Read the quantities, units and relationships, then check the counts or equations. These are original teaching models.
Turn category votes into circle sectors
All category amounts sum 36 and all central angles sum 360°. Each vote chooses one category, so the pie represents one partition of its stated whole.
A Art
12 votes give 120°, one-third of the recorded choices.
B Music
8 votes give 80°, eight of the 36 choices.
C Coding
6 votes give 60°, one-sixth of this total.
D Reading
4 votes give 40° of the full circle.
E Science
3 votes give 30°.
F Chess
3 votes give 30°, tying the Science share.
Original diagram using fictional classroom records, not measured personal information or current statistics. Read the quantities, units and conventions beside the figure; colour alone does not carry the meaning.
Explore the mathematical figures
Match each letter to its explanation. Read the quantities, units and relationships, then check the counts or equations. These are original teaching models.
Construct a four-category pie
135+90+81+54=360°. The whole counts items, not their prices, and no extra sector is added for the total.
A Blocks
15 of 40 items gives 135°.
B Balls
10 of 40 gives 90°, one quarter of the items.
C Cards
9 of 40 gives 81°.
D Puzzles
6 of 40 gives 54°.
Original diagram using fictional classroom records, not measured personal information or current statistics. Read the quantities, units and conventions beside the figure; colour alone does not carry the meaning.
Explore the mathematical figures
Match each letter to its explanation. Read the quantities, units and relationships, then check the counts or equations. These are original teaching models.
Recover a count from a supplied total
80/360×90=20 chosen votes. The same 80° angle would represent a different count if the whole were different.
Given total
N=90 votes is essential to turn a share into a count.
80°
Chosen share 80/360=2/9 of the full circle.
Other: 70
The remaining votes:90−20=70.
Original diagram using fictional classroom records, not measured personal information or current statistics. Read the quantities, units and conventions beside the figure; colour alone does not carry the meaning.
Your written practice
Show your working on paper. Check your answer, then choose Next.
Show model answer and explanation
14.5
The first ends at 14.5 and the second starts there under a half-open rule.
Show model answer and explanation
4
Four grid units represent four session records, with baseline 0.
Show model answer and explanation
0
The empty 10–20 interval remains in place with zero height.
Show model answer and explanation
0.3
Width 20 minutes;6/20=0.3 sessions per minute, so area 20×0.3=6 sessions.
Show model answer and explanation
0.6
Width 10 minutes;6/10=0.6 sessions per minute.
Show model answer and explanation
120
12/36×360=120°, representing one-third of the 36 votes.
Show model answer and explanation
80
8/36×360=80°, representing eight votes.
Show model answer and explanation
60
6/36×360=60°, one-sixth of the vote total.
Show model answer and explanation
20
90×80/360=20 votes; the supplied total is necessary.
Show model answer and explanation
135
15/40×360=135°, describing 15 of the 40 items.
Show model answer and explanation
81
9/40×360=81°, describing 9 of the 40 items.
Show model answer and explanation
30
The full circle is 360°; the listed angles sum 330°, leaving 30°.
Show model answer and explanation
25
9/36×100=25%, meaning one quarter of the recorded choices.
Show model answer and explanation
60
90° is one-quarter of 360°, so the total is 4×15=60 votes.
Show model answer and explanation
240
(29.5−9.5)×12=240 pixels; equal widths use one fixed scale.
Write in your own words. A guardian or teacher should review this response.
Show model answer and explanation
For nearest-minute records use boundaries 9.5,14.5,19.5,24.5,29.5. Draw equal-width touching rectangles of heights 3,4,2,1, with session length in minutes horizontally and session count vertically from 0. They describe ten invented sessions.
Check boundaries, common scale, heights, total and labels.
Write in your own words. A guardian or teacher should review this response.
Show model answer and explanation
The endpoint 20 would belong to both groups. Use an explicitly half-open continuous convention or convert stated rounded integer classes to appropriate boundaries. Every observation must enter exactly one interval.
Test the shared endpoint with the chosen inequalities.
Write in your own words. A guardian or teacher should review this response.
Show model answer and explanation
The 10–20 class is empty, so its rectangle has zero height. Leave its full ten-unit width between the first and third rectangles. Sliding later bars left would mislabel their intervals.
The empty interval is information, not decoration.
Write in your own words. A guardian or teacher should review this response.
Show model answer and explanation
With six sessions in each, densities are 0.6 and 0.3 sessions per minute. Width times height is 6 in both rectangles. The wider interval is shorter in height; equal raw-frequency heights would distort its area.
Define density and use both units and area.
Write in your own words. A guardian or teacher should review this response.
Show model answer and explanation
A marked horizontal break can omit values below the displayed class range while preserving equal bin widths. Counts still start at vertical zero. Cutting away that baseline can exaggerate relative heights, so show the full count scale or disclose a carefully justified change.
Identify which axis is broken and what values are omitted.
Write in your own words. A guardian or teacher should review this response.
Show model answer and explanation
The total is 36 one-choice votes. Angles are 120°,80°,60°,40°,30°,30°, summing 360°. Draw successive angles from one radius and label the categories. Art is one-third of these votes, not one-third of all children everywhere.
Use a protractor, legend and stated fictional total.
Write in your own words. A guardian or teacher should review this response.
Show model answer and explanation
Total 40 items gives angles 135°,90°,81°,54°, summing 360°. Label the whole as items in this invented toy box; do not mix item counts with toy prices or add a sector for total 40.
Check the total and every angle before drawing.
Write in your own words. A guardian or teacher should review this response.
Show model answer and explanation
The share is 80/360=2/9 of the whole. Multiplying 90 by 2/9 gives 20 votes. Without the total, the angle states only a share and cannot determine an absolute count.
State both the fraction and what it represents.
Write in your own words. A guardian or teacher should review this response.
Show model answer and explanation
Recompute from the original counts first. If the extra degree is only rounding, retain the original counts and explain a small drawing adjustment so the circle closes at 360°. Do not silently change observed category totals.
Separate calculation error, rounding and source-data revision.
Write in your own words. A guardian or teacher should review this response.
Show model answer and explanation
Its whole would be the sum of heights in centimetres. Each slice is one person’s share of that sum, not the proportion of people in a category. A one-choice preference count is a clearer example when the question concerns student shares.
Name the denominator and avoid confusing people with centimetres.
Write in your own words. A guardian or teacher should review this response.
Show model answer and explanation
It divides recorded accidents or deaths among categories, but risk per journey also needs how much each method was used and a comparable time/place. A large count may reflect more journeys. The source table is a classroom example, not a current verified risk report.
State the missing exposure information without drawing a safety ranking.
Write in your own words. A guardian or teacher should review this response.
Show model answer and explanation
Adjacent numerical length intervals suit a histogram. Mutually exclusive one-choice activity counts can form a pie of the vote total, or separate category bars. The first describes a numerical distribution and the second a composition.
Name what the horizontal scale or whole means.
Write in your own words. A guardian or teacher should review this response.
Show model answer and explanation
Overlapping categories count some records twice, so their sum is not one partition of the population. A zero total gives no defined f/N shares. Choose a different presentation or repair the category design before drawing.
Check nonnegative values, a positive whole and one category per counted item.
Write in your own words. A guardian or teacher should review this response.
Show model answer and explanation
The proportions are the same: an 80° sector is 2/9 of either circle. It represents 8 votes out of 36 or 20 out of 90. Equal angles do not imply equal absolute counts.
Use one named category and both supplied totals.
Write in your own words. A guardian or teacher should review this response.
Show model answer and explanation
Fictional 36 one-choice club votes: Art 12, Music 8, Coding 6, Reading 4, Science 3, Chess 3. Art is the largest recorded category with 12 votes, one-third of this total. These invented votes do not estimate preferences of all learners.
Include category amounts, whole, meaning and limitation; colour alone is not enough.
Progress and browser storage
Notebook challenge, sources and further study
Your data detective notebook
Make one histogram and one pie with written interpretations.
Review with a guardian or teacher
State the endpoint rule and both histogram axes.
Show the pie total, category amounts and angle check.
Explain one conclusion and one unsupported claim.
Keep your work on paper or in a local file. This page does not upload it or automatically grade the project.
Chapter companion and further study
This original Kidemy practice follows the topic order of 2026 Class 8 Mathematics · English Version, chapter 11, printed pages 171–187. It does not replace the complete chapter or its practical teaching.
Original companions teach the mapped methods rather than reproduce every exact printed question. Review independent written solutions, measurements and chart construction.
Chapter headings across the book now have original companions. This does not certify every textbook exercise or other Class 1–8 subject; those audits remain separate.
Teacher-led lessons, schedules and prices for this outline are upcoming. You can use any starter practice above now without booking.
Your next step
Solo practice works without an account. Sign in to save a practice record to your learner profile.
Keep practising
Exact lesson links and related activities are labelled separately. Return-to-course links retain your selected learning path.
![The four intervals[0,10),[10,20),[20,30),[30,40) have session counts 2,0,3,1. The empty second interval keeps its horizontal width.](/school/static/science-figures/math8-data-empty-bins.66e45428c450.svg)