2026 Class 8 Mathematics · English Version · Chapter 11 · Chapter companion part
Chapter 11C: Mean, weighted tables and grouped estimates
Explain an equal-share average, calculate it by several checked methods and distinguish exact recorded means from grouped estimates.
About this lesson and its coverage
Class 8 English Version: part C of the Chapter 11 companion. Eight teaching sections and 30 original written tasks. Selected companion coverage, not complete textbook coverage; use all four parts. Written interpretation, chart drawing and complete working need guardian or teacher review.
The arithmetic mean is the total of numerical observations divided by how many observations there are. It is the amount each would have if the total were shared equally. Our ten invented session lengths sum to 180 minutes, so their mean is 18 minutes per session. This describes that recorded total and count; it does not say every session lasted 18 minutes or that 18 is best. A mean needs numerical quantities with a meaningful unit, not arbitrary identity labels.
Read the formula as an instruction
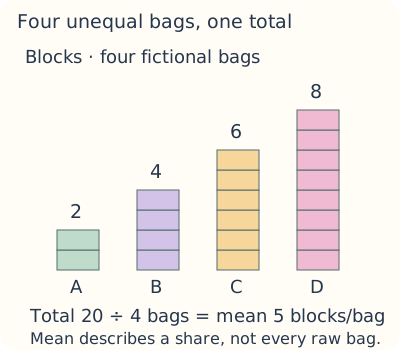
Write x̄=(x₁+…+xₙ)/n=Σxᵢ/n. The bar labels the mean, n is the observation count, xᵢ is record i and Σ means add the listed terms. Sum all records, including repeats, before dividing by n. For 2,4,6,8 blocks, total 20 shared over four bags is 5 blocks per bag. Five may be a virtual equal share; the actual bags still contained 2,4,6,8. The mean lies between the smallest and largest record when the list is nonempty.
Subtract a convenient reference, then restore it
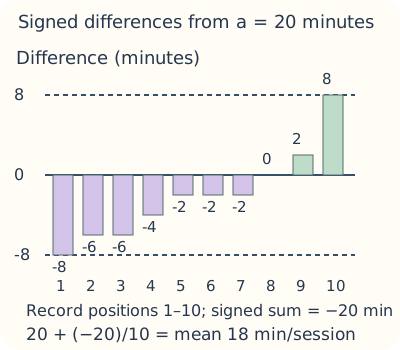
An assumed mean a is a convenient reference, not a claim about the answer. Let dᵢ=xᵢ−a. Then x̄=a+Σdᵢ/n because Σxᵢ=na+Σdᵢ. For our ten sessions, choose a=20 minutes. Their signed deviations sum−20 minutes; the correction is −2 minutes per session and the mean is 20−2=18 minutes. Choosing a=16 instead gives correction+2 and the same 18. Negative differences are essential.
A signed running sum is not a frequency
Printed pages 177–178 call the running sum of xᵢ−a cumulative frequency. That label is wrong: the column adds signed differences, so it can decrease or be negative and has the measurement unit. True cumulative frequency adds nonnegative record counts and ends at n. For our a=20 example, the running deviations begin−8,−14,−20 and finish−20 minutes. They do not count a negative number of sessions.
Use repeated-value frequencies as weights
For distinct recorded values xᵢ with frequencies fᵢ, total count is n=Σfᵢ and total quantity is Σfᵢxᵢ. Mean=Σfᵢxᵢ/Σfᵢ. For values 4,8,12 with counts 1,2,1, the expanded list is 4,8,8,12. Its total 32 and count 4 give mean 8. Averaging table rows equally ignores how many observations each row represents. Count all records, not merely the number of different values.
Grouped midpoint means are estimates
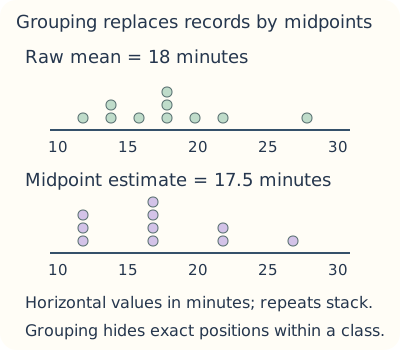
When only interval counts are known, replace each interval by its midpoint m=(lower limit+upper limit)/2 as a stated approximation. Our inclusive classes 10–14,15–19,20–24,25–29 have midpoints 12,17,22,27 and frequencies 3,4,2,1. Their midpoint total is 175 and estimated mean 17.5 minutes. The actual ten records have exact mean 18 minutes. Grouping hides the positions within each interval; another raw list could have the same counts and a different mean.
Check estimates and source arithmetic
For these integer width-five classes, every record is at most 2 minutes from its midpoint, so the true mean is within 2 minutes of the midpoint estimate if all records lie in their stated classes. This bound is not a probability or a promise of closeness within a smaller amount. Printed page 180 gives 89.5×4 as 348; it should be358. The corrected products give the displayed total 6190 and midpoint estimate 61.9. The estimate does not recover an unknown exact mean.
Recover totals before combining summaries
If n records have mean m, their total is nm. For five records with mean 14, total 70; if four known values total 52, the missing value is 18. For groups of sizes 4 and 6 with means 6 and 11, totals 24 and 66 combine to 90 over 10 records, giving mean 9. An unweighted average of 6 and 11 would wrongly give equal influence to unequal group sizes. Recheck units: when the source wage table says 100 taka, an invented mean estimate 62.5 table units would mean 6250 BDT. Distinguish exact recorded calculations from grouped estimates.
Worked example
Our original ten records have exact mean 18 minutes. Grouping them into four width-five classes and replacing every record by its midpoint gives 17.5 minutes, an estimate 0.5 minute lower here. Neither result certifies a learner’s ability or a universal study target.
Name the observations, unit, total and question. Explain what the requested summary or chart measures.
Show sorting, counts, boundaries or a fully labelled calculation. State whether the result is exact for the listed records or a grouped estimate.
Check totals, positions, units and arithmetic. Explain the result in context and say what the data cannot establish.
Running deviations do not count people
The source’s cumulative-frequency heading on its shortcut table should say running sum of signed deviations.
One product needs correction
On printed page 180,89.5×4=358, not 348. The corrected product agrees with the displayed 6190 total, which gives a grouped estimate rather than an exact raw mean.
Exact values preserve an exact weighted total
The ten invented reading-session lengths in minutes.
Exact values preserve an exact weighted total
Value x (minutes)
Frequency f
Product fx (minutes)
12
1
12
14
2
28
16
1
16
18
3
54
20
1
20
22
1
22
28
1
28
Total
10
180
The 18-minute row contributes three sessions and 54 minutes. Total 180/count 10 gives mean 18 minutes per session. Seven distinct rows do not mean seven records.
Assumed reference 20: signed running sums
Sorted fictional durations. These differences are in minutes; the last column does not count observations.
Assumed reference 20: signed running sums
Record
x (minutes)
d=x−20 (minutes)
Running signed sum (minutes)
1
12
−8
−8
2
14
−6
−14
3
14
−6
−20
4
16
−4
−24
5
18
−2
−26
6
18
−2
−28
7
18
−2
−30
8
20
0
−30
9
22
2
−28
10
28
8
−20
The final−20 means the actual total is 20 minutes below ten copies of 20. Dividing by ten gives correction−2 minutes per session. The book’s cumulative-frequency heading on a corresponding signed table is wrong.
Interval midpoints hide the original positions
These counts come from the same ten fictional sessions, but an interval alone does not give each raw value.
Interval midpoints hide the original positions
Inclusive class (minutes)
Midpoint m (minutes)
Frequency f
Product fm (minutes)
10–14
12
3
36
15–19
17
4
68
20–24
22
2
44
25–29
27
1
27
Total
Not added as values
10
175
The midpoint estimate 175/10=17.5 minutes is 0.5 minute below the exact raw mean 18 here. The discrepancy and its direction are not universal; choose and state the class origin and width.
Audit source products and units
Printed Example 5 and Exercise 6 use mathematical classroom data, not verified current financial evidence.
Audit source products and units
Source item
Correction or interpretation
Consequence
Printed 180 product 89.5×4
358, not 348
Other products sum 5832;5832+358=6190
Printed 180 total 6190 over 100
61.9 midpoint units per observation
An interval-based estimate, not a recovered raw mean
Exercise 6 unit:100 taka
One table unit means 100 BDT
An invented estimate 62.5 table units means 6250 BDT
Check arithmetic and units separately. None of these classroom amounts is a claim about present wages, account terms or a payment obligation.
Mean is total divided by record count
Ten fictional sessions have total 180 minutes.
x̄=Σxᵢ/n
x̄=180/10=18 minutes per session
x̄
Arithmetic mean: the equal-share amount.
Σxᵢ
Add every observed value, including repeats.
n
The positive count 10, not the number of distinct values.
Name the unit and observations.
Add the full list.
Count all records.
Divide and verify that mean×count restores the total.
18 minutes describes these ten records; it does not mean every session lasted 18 or prescribe an ideal duration.
The actual repeated value, when the exact-value table gives it.
mᵢ
Interval midpoint used as an approximation when exact within-class values are hidden.
Compute each value or midpoint.
Multiply by its frequency.
Sum products and frequencies separately.
Divide, label units and distinguish exact records from an estimate.
Our exact-value mean is 180/10=18 minutes, while the interval midpoint estimate is 175/10=17.5 minutes.
Combine totals, not unweighted group means
Four records have mean 6 units; six have mean 11 units.
Combined total=4×6+6×11=90 units
Combined count=4+6=10
Combined mean=90/10=9 units per record
4,6
The group sizes supply the weights.
6,11
The two supplied group means.
9
Equal-share summary across all ten records.
Recover each group total.
Add totals in the same unit.
Add group sizes.
Divide the combined total by the combined count.
The simple average(6+11)/2=8.5 wrongly gives equal influence to groups of different sizes.
Share twenty blocks to understand the mean
Four fictional bag counts. Move through the redistributions without changing the total.
All stages: readable static alternative
1 · Start from 2,4,6,8 blocks: Four original bag counts sum 20. A mean summarises this total and the four bags.
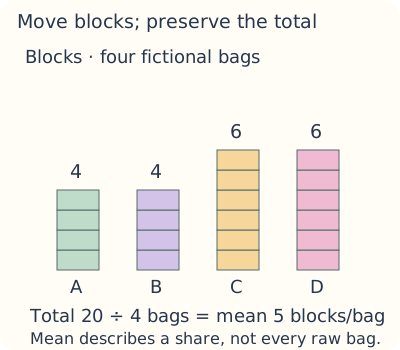
2 · Move blocks without losing any: Counts 4,4,6,6 still sum 20. Changing where blocks sit does not change total divided by bag count.
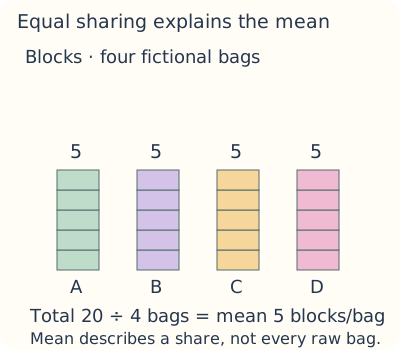
3 · Reach the equal share: Each bag now has 5. Thus 20/4=5 blocks per bag is the mean of the original counts; it does not assert that the raw bags originally matched.
No autoplay. Manual controls, static alternatives and reduced-motion handling remain available. This is a mathematical sharing model, not a change to stored observations.
Explore the mathematical figures
Match each letter to its explanation. Read the quantities, units and relationships, then check the counts or equations. These are original teaching models.
Explain the mean by equal sharing
The controlled sequence conserves all 20 blocks through 2,4,6,8 →4,4,6,6 →5,5,5,5. Mean is an equal-share summary; redistribution is a teaching model, not a claim that the raw records changed.
A
First bag; its original count was 2.
B
Second bag; originally 4.
C
Third bag; originally 6.
D
Fourth bag; originally 8.
mean 5
The equal share is 20/4=5 blocks per bag. The original observations were not all 5.
Original diagram using fictional classroom records, not measured personal information or current statistics. Read the quantities, units and conventions beside the figure; colour alone does not carry the meaning.
Explore the mathematical figures
Match each letter to its explanation. Read the quantities, units and relationships, then check the counts or equations. These are original teaching models.
Keep signed differences and counts separate
The mean correction is −20/10=−2 minutes per session, so20−2=18 minutes. Signed bars may be negative; cumulative frequency cannot decrease in a nonnegative count table.
Difference (minutes)
Vertical signed difference x−20; below zero means shorter than the reference.
Record positions
Horizontal labels 1–10 identify observations in this sorted display, not session durations.
signed sum
The total−20 minutes is a deviation total, not a negative frequency.
Original diagram using fictional classroom records, not measured personal information or current statistics. Read the quantities, units and conventions beside the figure; colour alone does not carry the meaning.
Explore the mathematical figures
Match each letter to its explanation. Read the quantities, units and relationships, then check the counts or equations. These are original teaching models.
See what grouped midpoint replacement hides
The raw row totals 180; replacements 12,12,12,17,17,17,17,22,22,27 total 175. Grouping shifts this estimate 0.5 minute below the exact mean, but the difference need not be the same for another raw list.
Raw mean
The exact mean of these recorded durations is 18 minutes.
Midpoint estimate
Replacing each interval by its midpoint gives 17.5 minutes.
Horizontal values
Positions show minutes on one fixed 10–30 scale; stacked points are repetitions.
Original diagram using fictional classroom records, not measured personal information or current statistics. Read the quantities, units and conventions beside the figure; colour alone does not carry the meaning.
Your written practice
Show your working on paper. Check your answer, then choose Next.
Show model answer and explanation
18
Total 180 divided by 10 gives 18 minutes per session: the equal share, not every actual duration.
Show model answer and explanation
180
Mean×count=18×10=180 minutes.
Show model answer and explanation
18
Total 5×14=70; known sum 52, leaving 18.
Show model answer and explanation
18
20+(−20)/10=18 minutes; the negative correction lowers the reference.
Show model answer and explanation
18
16+20/10=18 minutes; a new reference must give the same mean.
Show model answer and explanation
8
Weighted total 4+16+12=32 and count 4 give 8 per observation.
Show model answer and explanation
4
1+2+1=4 records, although there are only three distinct table values.
Show model answer and explanation
32
1×4+2×8+1×12=32 units in total.
Show model answer and explanation
17.5
(12×3+17×4+22×2+27×1)/10=175/10=17.5 minutes; it is a midpoint estimate.
Show model answer and explanation
0.5
18−17.5=0.5 minutes; the estimate is half a minute low for these particular records.
Show model answer and explanation
27
(25+29)/2=27, a representative value used in a stated estimate.
Show model answer and explanation
6250
62.5×100=6250 BDT. This remains a grouped estimate, not a verified real wage.
Show model answer and explanation
14
Old total 40 plus 30 gives 70 over five records; the mean becomes 14.
Show model answer and explanation
9
(4×6+6×11)/(4+6)=90/10=9 units per record.
Show model answer and explanation
2
Each record differs from its class midpoint by at most 2, so the average difference has magnitude at most 2. This is a bound, not a probability.
Write in your own words. A guardian or teacher should review this response.
Show model answer and explanation
Their total 180 minutes divided by 10 is 18 minutes per session. It is the equal-share summary of these records; individual durations vary and it does not measure ability or prescribe an ideal study time.
Name the total, denominator, unit and interpretation.
Write in your own words. A guardian or teacher should review this response.
Show model answer and explanation
x̄ is the mean, xᵢ is an individual bag count, n=4 is the number of bags and Σ adds all four counts. Total 20/4 gives 5 blocks per bag under equal sharing, while the actual bags keep their listed counts.
Translate the formula into words and preserve the unit.
Write in your own words. A guardian or teacher should review this response.
Show model answer and explanation
12+14+14+16+18+18+18+20+22+28=180. Divide by 10 to get 18 minutes. It lies between 12 and 28, and 18×10 restores the total 180.
A plausible size check supports the arithmetic but is not a substitute for summing.
Write in your own words. A guardian or teacher should review this response.
Show model answer and explanation
Each record xᵢ=a+dᵢ. Summing n records givesΣxᵢ=na+Σdᵢ. Divide by n>0 to obtain x̄=a+Σdᵢ/n. Signed differences retain information below the reference.
Define a, dᵢ, n and show why the reference is added back.
Write in your own words. A guardian or teacher should review this response.
Show model answer and explanation
Deviations are−8,−6,−6,−4,−2,−2,−2,0,2,8 minutes. Their sum is −20, meaning the total lies 20 minutes below ten copies of 20. The correction−20/10=−2 gives mean 18 minutes.
Label the running column as a signed sum, never cumulative frequency.
Write in your own words. A guardian or teacher should review this response.
Show model answer and explanation
Its entries add xᵢ−a, so they are running signed deviations with the value unit. A cumulative frequency instead adds observation counts, cannot decrease when counts are nonnegative and ends at n. The source’s final 115 is a deviation total, not 115 people out of 20.
Describe both columns and how their meanings differ.
Write in your own words. A guardian or teacher should review this response.
Show model answer and explanation
Relative to 16 the deviations total 20, giving 16+20/10=18. Relative to 20 they total−20, giving 20−20/10=18. Changing the reference changes the correction but leaves the original total and count unchanged.
Compare both signed corrections with units.
Write in your own words. A guardian or teacher should review this response.
Show model answer and explanation
Values 12,14,16,18,20,22,28 have frequencies 1,2,1,3,1,1,1. Products are 12,28,16,54,20,22,28, totalling 180. Frequencies total 10, so the exact recorded mean is 18 minutes.
Do not divide by seven distinct rows instead of ten observations.
Write in your own words. A guardian or teacher should review this response.
Show model answer and explanation
Values 2 and 8 with counts 3 and 1 expand to 2,2,2,8. The mean is 14/4=3.5, not(2+8)/2=5. The more frequent value has more records and must have greater weight.
Use a fully stated list and explain the weighting.
Write in your own words. A guardian or teacher should review this response.
Show model answer and explanation
Midpoints 12,17,22,27 give products 36,68,44,27, total 175. Estimated mean 175/10=17.5 minutes. The original records have mean 18, so the estimate is 0.5 minute low in this example; another list with the same class counts need not have that difference.
State approximation, hidden information and unit.
Write in your own words. A guardian or teacher should review this response.
Show model answer and explanation
Each integer in 10–14 differs from midpoint 12 by at most 2, and similarly for every equal class. Averaging those signed replacement differences cannot exceed 2 in magnitude. This is a worst-case bound under the stated grouping, not a chance statement or a guarantee that every estimate is nearly exact.
Do not apply the same 2-unit bound to wider or continuous bins without checking them.
Write in your own words. A guardian or teacher should review this response.
Show model answer and explanation
For midpoint 89.5 with frequency 4, the product is 358, not 348. With the other displayed products,358 yields total 6190 and estimated mean 61.9 over 100 records. The exact raw mean is still unavailable from intervals alone.
Show the corrected product and preserve the estimate label.
Write in your own words. A guardian or teacher should review this response.
Show model answer and explanation
The total must be5×14=70. Known values sum 52, so the missing value is 18. Adding 18 gives 70 and dividing by 5 checks 14.
Recover a total before subtracting the known values.
Write in your own words. A guardian or teacher should review this response.
Show model answer and explanation
Four records at mean 6 contribute 24 units and six at mean 11 contribute 66. The combined mean is 90/10=9. Averaging 6 and 11 directly gives 8.5 and wrongly makes four records count as much as six.
State both totals, total count and resulting unit.
Write in your own words. A guardian or teacher should review this response.
Show model answer and explanation
For an empty list n=0, division by n is undefined, so there is no arithmetic mean to report. For a nonempty list of 7s, total 7n/n=7; the equal-share value agrees with every record.
Distinguish no data from a genuine zero-valued mean.
Progress and browser storage
Notebook challenge, sources and further study
Your data detective notebook
Compare three routes to one mean and report the grouping loss.
Review with a guardian or teacher
Show direct, assumed-reference and exact-value frequency calculations.
Compute a midpoint estimate with its convention and units.
Explain why grouped records do not recover every original value.
Keep your work on paper or in a local file. This page does not upload it or automatically grade the project.
Chapter companion and further study
This original Kidemy practice follows the topic order of 2026 Class 8 Mathematics · English Version, chapter 11, printed pages 171–187. It does not replace the complete chapter or its practical teaching.
Original companions teach the mapped methods rather than reproduce every exact printed question. Review independent written solutions, measurements and chart construction.
Chapter headings across the book now have original companions. This does not certify every textbook exercise or other Class 1–8 subject; those audits remain separate.
Teacher-led lessons, schedules and prices for this outline are upcoming. You can use any starter practice above now without booking.
Your next step
Solo practice works without an account. Sign in to save a practice record to your learner profile.
Keep practising
Exact lesson links and related activities are labelled separately. Return-to-course links retain your selected learning path.